
Using Metaanalysis to Evaluate Evidence: Practical Tips and Traps
Abstract
Although practising evidence-based medicine is the goal of most physicians, it can be a real challenge to sift through the vast body of data to determine the best strategies. Most clinical guidelines regard replicated randomized controlled trials (RCTs), metaanalyses, and systematic reviews as the highest level of evidence to support treatment recommendations. High-quality metaanalyses can overcome many of the drawbacks of individual RCTs and qualitative reviews. They can reduce bias, provide adequate power to demonstrate real differences in outcomes, and resolve the results of inconsistent studies. This paper focuses on basic principles and terms used in metaanalysis, so that clinicians can appropriately evaluate and use their results to guide treatment decisions.
(Reprinted with permission from the Canadian Journal of Psychiatry 2005; 50:167–174)
The foundation of evidence-based psychiatry is proper evaluation of the evidence base. However, the body of evidence currently available on the management of psychiatric disorders is huge. For major depressive disorder (MDD) alone, a PubMed search from 1960 to 2004 yields over 6500 citations. These include clinical trials, reviews, opinion papers, editorials, guidelines, and more—many of which yield conflicting results and offer inconsistent advice. How, then, does a busy clinician determine what evidence is useful in clinical practice?
The gold standard for evaluating efficacy is still a properly conducted randomized controlled trial (RCT). Randomly assigning patients to an intervention eliminates any bias from unknown characteristics of the sample that might contribute to treatment effects by balancing these characteristics evenly across intervention groups. Large, stringently executed RCTs can provide statistically and clinically relevant information, particularly if the results have been replicated in more than one trial. Uncontrolled studies such as cohort studies and case series are subject to many biases and are only useful in the absence of more rigorous data. Higher response rates tend to be reported in uncontrolled studies, while RCT evaluation shows less effect. For example, pindolol augmentation of selective serotonin reuptake inhibitors (SSRIs) for treatment-resistant depression had impressive results in early case series, but later RCTs showed no differences, compared with placebo (1, 2).
Most clinical practice guidelines, including the Canadian Guidelines for the Treatment of Depressive Disorders (3), consider that replicated RCTs represent the highest level of evidence (Table 1). The higher the level of evidence, the greater the confidence in the magnitude and relevance of a clinical intervention. Individual RCTs, however, can be subject to bias, can be too small to show real differences in outcomes, can have conflicting results, or can include heterogeneous patient populations. This is especially true when 2 active treatments (such as 2 antidepressants) are compared, because very large sample sizes are required to find relatively small treatment differences that may nonetheless be clinically relevant. Hence reviews of the literature are important to arrive at an overall conclusion. Previously, reviews were often conducted by experts in the field who evaluated the published studies in a more or less systematic manner. It was usually not clear, however, how studies were identified, selected, or weighted to arrive at the conclusion. Simple counting of studies (positive and negative) is possible, but this does not allow weighting of studies by sample size or study quality (4).
 |
 |
Table 1. Criteria for Levels of Evidence from the Clinical Guidelines for the Treatment of Depressive Disorders (3)
Because of the limitations of qualitative reviews, there is increasing attention to systematic reviews. Systematic reviews involve a comprehensive search and selection of relevant studies according to explicit criteria, as well as a specific method of evaluation that includes a quantitative synthesis such as metaanalysis (5, 6). Metaanalysis (a term often used synonymously with systematic review) can summarize various findings of multiple RCTs more objectively than can expert opinion or qualitative reviews (5–7). The Cochrane Collaboration publishes the Cochrane Database of Systematic Reviews, an electronic library of up-to-date metaanalyses of RCTs using rigorous methodology and standardized reporting methods (8–11). Clinical guidelines now also recognize metaanalyses, along with replicated RCTs, as the highest level of evidence (Table 1).
 |
Metaanalysis, like any study methodology, has both strengths and limitations. It remains important for clinicians to understand the key principles of metaanalysis to properly evaluate the relevance of the results. This paper briefly discusses some of the concepts and methods of evaluating studies, with a focus on metaanalysis, and examines issues that influence their quality and clinical relevance.
METAANALYSIS
A metaanalysis is the statistical combination of at least 2 studies, and usually many more, to produce a single estimate of the magnitude of the effect of the intervention under investigation (5). Previously, standardization of methodology for metaanalysis has been limited, but this is improving. The Quality of Reporting of Meta-analyses (QUOROM) statement (12) provides a checklist for standardizing and improving the reporting of metaanalyses, similar to the Consolidated Standards of Reporting Trials (CONSORT) statement for RCTs (13).
The design of a high-quality metaanalysis should meet the standards one would expect in the design of a high-quality RCT (Table 2). These include an explicit clinical question, appropriate criteria for study inclusion, appraisal of the included studies' validity, and assessment of whether the total sample is large enough to provide reliable, generalizable results (14, 15).
 |
Table 2. Checklist for Evaluation of Randomized Controlled Trials and Metaanalyses
What is the clinical question?
A clearly formulated, primary question is central to any high-quality metaanalysis (5, 14). The primary question, developed a priori, determines the central focus of the review, helps physicians assess the relevance of the analysis to their practice, and dictates selection criteria for the studies included (5). The question depends on the available data, as the metaanalyst has little control over populations of patients, treatment regimens, or outcome definitions in the original trials (5, 15).
Clearly formulated questions contain the dimensions of the study population or patient type (for example, with or without comorbidities, hospitalized or outpatient), the intervention used, general or specific treatment strategies (for example, any antidepressant or a specific one), and outcomes measured (for example, effect size, remission, response, or relapse) (16).
What studies are included in the metaanalysis?
The next step of a metaanalysis is to identify all relevant studies that address the question. A systematic literature search is complex and tougher than it sounds. The metaanalysis should specify elements of the literature search, including the search strategy (for example, key words selected and language of publication), the electronic databases used (for example, Medline, Embase, or Cochrane Clinical Trial Registry), and other search methods (for example, a manual search of bibliographies of relevant papers or contacting investigators in the field).
There is debate about the importance of including “gray literature”(that is, unpublished and difficult-to-retrieve studies) in a metaanalysis (12). Excluding this literature may introduce bias if the trial results differ from those that are included. Failure to publish—the so-called “file drawer”effect (which refers to negative studies that are filed away in a drawer) (17)—is not a random event: studies indicate that publication bias exists, in that the positive studies are more likely to be published than are negative or neutral results (18–20). For example, in one study of 767 published RCTs, 55% favoured the new therapy, whereas only 14% of 178 unpublished reports contained positive results (P < 0.001) (18). The exclusion of gray literature from metaanalyses has been reported to overestimate the treatment effect by 15% (21). The recent controversy about the efficacy and safety of newer antidepressants in children and adolescents illustrates this point. The 5 published reports on SSRIs in the pediatric age group showed evidence for efficacy, but a systematic review that included 9 unpublished studies found overall lack of efficacy (22, 23). Conversely, unpublished studies have not been subject to scientific peer review and so may be of poorer quality.
Once all potential available studies for the metaanalysis have been identified, the next question regards the criteria for study inclusion. The quality of a metaanalysis is largely determined by the quality of the studies included (24). When separate metaanalyses arrive at different conclusions about the same study question, it is usually the result of differences in the studies included and in the amount of information culled from these studies. For example, a metaanalysis that includes only RCTs can have different conclusions from a metaanalysis that also includes uncontrolled studies. Two reviewers using defined criteria to independently select studies can improve reliability of the selection process.
For a metaanalysis to provide reliable information, it should meet the same standards as a single, well-designed, large RCT (15). Trial aspects that have been used to assess quality include reporting style, level of bias, generalizability, statistical analyses and design, data presentation, and the clinical relevance of the intervention (24). Including low-quality studies can exaggerate the benefits of the treatment (12, 25).
POOLED ANALYSIS VS METAANALYSIS
A specific type of metaanalysis pools the data from individual patients in several studies and analyzes these data as if they were from one large study (Table 3). A pooled analysis can be a powerful method to reveal smaller, yet clinically relevant, differences among treatments than can be detected by one study alone. Because the data are similar, the treatment effect can be expressed as an absolute risk reduction (ARR), or risk difference (that is, the actual difference in the outcomes between the treatment groups) (26, 27). The treatment effect may also be expressed as a relative risk (RR) (that is, the ratio of the outcome in the treatment group relative to that in the control group) (7, 26, 27). If there is no difference between treatments, the RR is equal to 1.0; if the first treatment is better than the second, the RR is greater than 1.0; and if the control treatment is better, the RR is less than 1.0 (26, 27). The ARR and RR usually make more sense to clinicians than do other statistics, such as odds ratios (ORs). Additionally, since all the data on patient variables are available, other analyses can examine whether specific factors, such as age, sex, or duration of illness, contribute significantly to the treatment effects.
 |
Table 3. Characteristics of Pooled Analysis Compared with Metaanalysis
Clinical example 1
A pooled analysis was conducted of 8 comparable double-blind RCTs of venlafaxine vs SSRIs (fluoxetine, paroxetine, and fluvoxamine; n=748) (28). These studies could be combined because of their design similarities: all were 6 to 8 weeks in length, enrolled similar patient types, and used similar outcome measures. Four studies were placebo-controlled. In the pooled intent-to-treat analysis at endpoint, the overall remission rates for venlafaxine, the SSRIs, and placebo were 45%, 35%, and 25%, respectively. The ARR for venlafaxine, compared with the SSRIs, is 45%−35%=10%; that is, an additional 10% of patients treated with venlafaxine achieved remission, compared with patients treated with SSRIs. The RR is 45%/35%=1.29; that is, in this pooled analysis, venlafaxine produced the desired outcome—remission—29% more often than did the SSRIs.
The limitation of pooled analyses is that they can only be performed when study methodologies are very similar. Since many studies use different methods (such as different inclusion criteria, duration of treatment, or outcome measures), the data cannot be easily pooled. Also, it is often difficult or impossible to obtain original data from investigators, so pooled analyses tend to come from either pharmaceutical companies that have access to their own data or from investigators involved in small, original studies wherein data are more easily shared. For more heterogeneous studies, other quantitative metaanalytic methods must be used.
A potential liability of pooled analyses is that some relevant studies may not be included, particularly those with less favourable outcomes. Similar to the file drawer effect, the issue of “cherry picking”positive studies can be addressed by specifying the criteria for study selection. For example, in clinical example 1, the 8 venlafaxine studies for the pooled analysis were selected because they were used for registration with the US Food and Drug Administration (28). A subsequent pooled analysis, the Comprehensive Pooled Analysis of Remission Data (COMPARE), included the full dataset of 33 published and unpublished Wyeth-sponsored studies of venlafaxine (29) and confirmed the earlier analysis results.
STATISTICAL METHODS OF METAANALYSIS
Other metaanalytic techniques depend on whether the outcome is continuous (for example, scores on a depression scale) or dichotomous (that is, a “yes or no” outcome, as in remission or no remission, 30). There are different measures to express the effects of an intervention, for example, effect size (ES, also known as standardized mean difference) for continuous data and ORs for dichotomous outcomes. In a metaanalysis, the standardized measure from each study is weighted by a number proportional to the sample size to derive a weighted average over all the studies; the variance of the measure can also be computed to give an indication of the variability of the findings (that is, the homogeneity or heterogeneity of effects) across studies (4, 17, 30).
ES allows outcomes based on different scales or measured in different units to be compared (4, 30, 31). One example of an ES is the difference in mean scores between treatments divided by the pooled SD (see clinical example 2) (4, 7). The larger the ES, the larger the difference between treatments. In behavioural studies, ES's of 0.2, 0.5, and 0.8 have been suggested to indicate small, medium, and large effects, respectively (32).
Clinical example 2
An RCT was conducted comparing fluoxetine (n=36) and placebo (n=32) in MDD with a seasonal pattern (33). At the end of treatment, the mean (SD) change in Hamilton Depression Rating Scale scores for fluoxetine and placebo were 18.5 (8.1) and 14.5 (9.4), respectively. The pooled SD was calculated as 8.7. The ES is calculated as (18.5−14.5)/8.7=0.46, indicating a moderate effect size. A metaanalysis of 7 studies comparing fluoxetine and placebo in MDD found a significant small-to-medium ES of 0.3 (34), similar to the ES of 0.3 found in a metaanalysis of empirically supported psychotherapies for depression (35).
The OR is a common way of estimating the effect of treatment in trials with dichotomous outcomes. For example, if remission is the event of interest, the odds for remission with treatment A is the probability (P) of achieving remission divided by the probability of not achieving remission (1−P). The OR is then calculated by dividing the odds for remission with treatment A by the odds in the control, or treatment B, group (4, 27). Like an RR, if the OR is exactly 1.0, there is no difference on outcome between the interventions; that is, the odds are 50:50, or even. If an OR is greater than 1.0, then treatment A increases the odds of the outcome, and if less than 1.0, it decreases the odds (7, 27).
Clinical example 3
In an RCT comparing bupropion (n=63) with trazodone (n=61), the clinical response rates by criteria on the Clinical Global Improvement scale of “much improved” or “very much improved” after 6 weeks were 58% and 46%, respectively (36). The odds of response for bupropionare 0.58/(1−0.58)=0.58/0.42=1.38; the odds of response for trazodone are 0.46/(1−0.46)=0.46/0.54=0.85. The OR for bupropion vs trazodone is 1.38/0.85=1.62, indicating that in this study the odds are 62% better for achieving clinical response with bupropion, compared with trazodone.
In a metaanalysis, ORs are often presented in graphic form (Figure 1) (37). The diamond represents the mean OR and the horizontal line indicates the 95% confidence interval (95%CI, or the range in which there is a 95% probability of the “true”OR residing). The smaller the 95%CI, the greater the confidence in the mean result. If the line representing the 95%CI crosses 1.0, the result is not statistically significant.
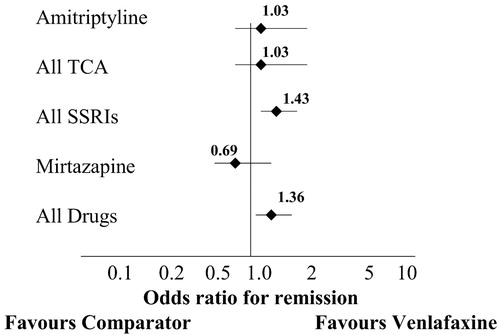
In this metaanalysis, venlafaxine was superior overall to other antidepressants (pooled as a group), with an OR of 1.36 (note the line representing the 95%CI does not cross 1.0, indicating a significant effect). However, when venlafaxine was compared against single antidepressants or classes of antidepressants, the only statistically significant finding was that venlafaxine was superior to the selective serotonin reuptake inhibitors (OR=1.43). Horizontal lines associated with the data points are 95%CIs.
Regression analyses (for example, logistic regression for dichotomous variables or ordinary least squares regression for continuous data) are statistical modelling techniques that can be used in a metaanalysis to predict the relative influence of more than one variable on outcomes (27). For example, regression analyses would determine the effect of age or sex or treatment duration or dosage on the efficacy of a pharmacologic intervention for depression. However, the number of variables that can be examined is often limited in a metaanalysis, because only the means from each study can be used.
LIMITATIONS OF METAANALYSIS
The results of a metaanalysis are only as good as the quality of the studies that are included. Therefore, the critical step in a metaanalysis is to formulate the inclusion criteria for selecting studies. If the inclusion criteria are too broad, poor quality studies may be included, lowering the confidence in the final result. If the criteria are too strict, the results are based on fewer studies and may not be generalizable.
For example, 3 metaanalyses have been published on the efficacy of repeated transcranial magnetic stimulation (rTMS) for depression. The 2 earlier metaanalyses found large, significant ESs of 0.62 and 0.81 (38, 39), respectively, while the third metaanalysis, selecting from almost the same studies, found a much smaller, though still significant, ES of 0.39 (40). The difference was that the first 2 metaanalyses included some nonrandomized studies, while the third study did not. The stricter inclusion criteria of the third metaanalysis led to a smaller ES that more accurately represents the efficacy of rTMS for depression. However, the authors also noted major methodological deficiencies in most of the 9 RCTs included in the third metaanalysis, including a total patient number of 175 in the studies reviewed (40). Hence the results of a metaanalysis, especially when it comprises small studies, should still be confirmed by large-scale RCTs.
Different study parameters exist in different trials, and factors such as illness severity, comorbid conditions, and concomitant treatments can have effects on outcome additional to the intervention being studied. Most investigators conduct an analysis of homogeneity-heterogeneity to identify whether there are significant differences among the results of the individual studies being assessed (14, 41). Significant heterogene ity suggests that the studies are not measuring a common population effect and that the differences in study parameters are likely responsible for the varying treatment effect (14). Different schools of thought exist regarding how much homogeneity is required for appropriate comparisons. Some would include only studies using similar therapies and patient types (42, 43), since otherwise it is not possible to determine which treatment made a difference for which patients (30). However, in this case the results cannot be generalized to other patients (41). Others would include most studies (44, 45), arguing that exact replications are rare, that heterogeneity allows the results to be generalized to a greater degree, and that statistical techniques (for example, regression analyses) can be used to calculate whether magnitude of the result depends on the type of intervention or on the type of patient.
Including only published studies can skew the results of a metaanalysis, particularly if there are a large number of unpublished studies with negative results. Many metaanalyses conduct a sensitivity analysis to determine the potential effect of publication bias and the file drawer effect. One such method is to calculate the number of unpublished and unidentified articles with nonsignificant results that would have to exist to make a significant effect no longer significant (17). The fewer studies needed to achieve this result, the more questionable the results of the metaanalysis.
HOW DOES THE METAANALYSIS APPLY TO CLINICAL PRACTICE?
There are several things to consider when applying RCT or metaanalysis results to management decisions in clinical practice. First, do the results apply to your patients? Second, are the outcomes clinically meaningful to your patients? Third, is the magnitude of the results clinically relevant?
In an RCT, the results clearly can be applied with confidence if your patient fits all the enrolment criteria and would not have been excluded from the analyses (46). If your patient would not have been eligible for the trial, the results can still likely be generalized if there are no compelling reasons why your patient is inappropriate or unlikely to benefit from the intervention. For example, in older patients, the benefits of tricyclic antidepressants may be outweighed by the increased risk of detrimental effects on cognition (47, 48). The same is true for the results of metaanalyses, with the advantage that the diverse range of patients from many studies (if the results are consistent across trials) allows the results to be generalizable to a wide variety of patients (14). Subgroup analysis can also provide useful information for applying the results to a specific patient type.
It is also important to determine whether the outcomes measured are clinically relevant for your patients. For example, a clinical response to therapy (that is, >50% reduction in depressive symptoms at endpoint) will leave some patients still suffering from significant depression. A more clinically relevant outcome in depression is clinical remission (that is, depression scores within the normal range at endpoint) (49). Other outcomes, including cognitive or behavioural effects and short-term and long-term adverse events, should also be considered.
The number needed to treat (NNT) can be useful to represent the magnitude of the treatment benefit in clinically relevant terms (4, 46). The NNT is calculated as the inverse of the absolute risk difference between treatment groups and provides an estimate of how many people need to receive a treatment before one additional person would experience the beneficial outcome (4, 27, 50). For example, in Clinical Example 1, the pooled analysis of 8 studies comparing remission rates with venlafaxine with those of SSRIs (28), the NNT is 10 (0.45−0.35=0.10; 1/0.10=10), which means that 10 patients need to be treated with venlafaxine to produce one additional remission, compared with SSRI treatment. An NNT of 20 or less is usually considered to be clinically relevant in acute treatment of chronic diseases, while a higher NNT may still be relevant in risk reduction for severe outcomes. Table 4 shows the NNT for treatments for some other medical conditions (51–55).
 |
Table 4. Examples of Number Needed to Treat
SUMMARY
High-quality metaanalyses are regarded as examples of the highest level of evidence in evidence-based medicine. Metaanalyses can overcome many of the drawbacks of individual RCTs and qualitative reviews, but they also have limitations: primarily, they are only as good as the studies they summarize. By understanding the basic principals of metaanalysis, clinicians can better evaluate and use their results to guide treatment selection and, ultimately, to optimize patient outcomes.
1 Blier P, Bergeron R. Effectiveness of pindolol with selected antidepressant drugs in the treatment of major depression. J Clin Psychopharmacol 1995;15:217–22. Crossref, Google Scholar
2 Perez V, Soler J, Puigdemont D, Alvarez E, Artigas F. A double-blind, randomized, placebo-controlled trial of pindolol augmentation in depressive patients resistant to serotonin reuptake inhibitors. Grup de Recerca en Trastorns Afectius. Arch Gen Psychiatry 1999;56:375–9. Crossref, Google Scholar
3 Kennedy SH, Lam RW, Cohen N, Ravindran A. Clinical guidelines for the treatment of depressive disorders. IV. Medications and other biological treatments. Can J Psychiatry 2001;46(Suppl 1):38S–58S. Google Scholar
4 Moher D, Jadad A, Klassen T. Guides for reading and interpreting systematic reviews: III. How did the authors synthesize the data and make their conclusions? Arch Pediatr Adolesc Med 1998;152:915–20. Crossref, Google Scholar
5 Klassen T, Jadad A, Moher D. Guides for reading and interpreting systematic reviews: I. Getting started. Arch Pediatr Adolesc Med 1998;152:70–4. Crossref, Google Scholar
6 Cook D, Sackett D, Spitzer W. Methodologic guidelines for systematic reviews of randomized controlled trials in health care from the Potsdam consultation on meta-analysis. J Clin Epidemiol 1995;167–71. Google Scholar
7 Anderson I. Meta-analytical studies on new antidepressants. Br Med Bull 2001;57:161–78. Crossref, Google Scholar
8 Bero L, Rennie D. The Cochrane Collaboration. Preparing, maintaining, and disseminating systematic reviews of the effects of health care. JAMA 1995;274:1935–8. Crossref, Google Scholar
9 Jadad A, Haynes R. The Cochrane Collaboration—advances and challenges in improving evidence-based decision making. Med Decis Making 1998;18:2–9, discussion 16–8. Crossref, Google Scholar
10 Jadad A, Cook D, Jones A, Klassen T, Tugwell P, Moher M, and others. Methodology and reports of systematic reviews and meta-analyses: a comparison of Cochrane reviews with articles published in paper-based journals. JAMA 1998;280:278–80. Crossref, Google Scholar
11 The Cochrane Collaboration. Available: http://www.cochrane.org/index0.htm Google Scholar
12 Moher D, Cook D, Eastwood S, Olkin I, Rennie D, Stroup D. Improving the quality of reports of meta-analyses of randomised controlled trials: the QUOROM statement. Quality of reporting of meta-analyses. Lancet 1999;354:1896–900. Crossref, Google Scholar
13 Moher D, Schulz K, Altman D. The CONSORT statement: revised recommendations for improving the quality of reports of parallel-group randomized trials. JAMA 2001;285:1987–91. Crossref, Google Scholar
14 Oxman A, Cook D, Guyatt G. Users' guides to the medical literature. VI. How to use an overview. Evidence-Based Medicine Working Group. JAMA 1994;272:1367–71. Crossref, Google Scholar
15 Pogue J, Yusuf S. Overcoming the limitations of current meta-analysis of randomised controlled trials. Lancet 1998;351:47–52. Crossref, Google Scholar
16 Oxman A, Guyatt G. Guidelines for reading literature reviews. CMAJ 1988;138:697–703. Google Scholar
17 Rosenthal R. The “file drawer problem” and tolerance for null results. Psychol Bull 1979:638–41. Google Scholar
18 Dickersin K, Chan S, Chalmers T, Sacks H, Smith H. Publication bias and clinical trials. Control Clin Trials 1987;8:343–53. Crossref, Google Scholar
19 Dickersin K, Min Y. Publication bias: the problem that won't go away. Ann N Y Acad Sci 1993;703:135–46, discussion 46–8. Crossref, Google Scholar
20 Dickersin K, Min Y, Meinert C. Factors influencing publication of research results. Follow-up of applications submitted to two institutional review boards. JAMA 1992;267:374–8. Crossref, Google Scholar
21 McAuley L, Pham B, Tugwell P, Moher D. Does the inclusion of grey literature influence estimates of intervention effectiveness reported in meta-analyses? Lancet 2000;356:1228–31. Crossref, Google Scholar
22 Whittington CJ, Kendall T, Fonagy P, Cottrell D, Cotgrove A, Boddington E. Selective serotonin reuptake inhibitors in childhood depression: systematic review of published versus unpublished data. Lancet 2004;363:1341–5. Crossref, Google Scholar
23 Lam RW, Kennedy SH. Prescribing antidepressants for depression in 2005: recent concerns and recommendations. Can J Psychiatry. Forthcoming. Google Scholar
24 Jadad A, Moher D, Klassen T. Guides for reading and interpreting systematic reviews: II. How did the authors find the studies and assess their quality? Arch Pediatr Adolesc Med 1998;152:812–7. Crossref, Google Scholar
25 Moher D, Pham B, Jones A, Cook D, Jadad A, Moher M, and others. Does quality of reports of randomised trials affect estimates of intervention efficacy reported in meta-analyses? Lancet 1998;352:609–13. Crossref, Google Scholar
26 Guyatt G, Sackett D, Cook D. Users' guides to the medical literature. II. How to use an article about therapy or prevention. B. What were the results and will they help me in caring for my patients? Evidence-Based Medicine Working Group. JAMA 1994;271:59–63. Crossref, Google Scholar
27 Cochrane Collaboration Consumer Network. Research glossary. Available: http://www.cochraneconsumer.com/index.asp?SHOW=Understanding, 2003. Google Scholar
28 Thase M, Entsuah A, Rudolph R. Remission rates during treatment with venlafaxine or selective serotonin reuptake inhibitors. Br J Psychiatry 2001;178:234–41. Crossref, Google Scholar
29 Nemeroff C, Entsuah A, Willard L, Demitrack M, Thase M. Venlafaxine and SSRIs: Pooled remission analysis [Abstract NR 263].
30 Streiner D. Using meta-analysis in psychiatric research. Can J Psychiatry 1991;36:357–62. Crossref, Google Scholar
31 Streiner D. Sample size and power in psychiatric research. Can J Psychiatry 1990;35:616–20. Crossref, Google Scholar
32 Cohen J. Statistical power analysis for the behavioural sciences. Orlando (FL): Academic Press; 1977. Google Scholar
33 Lam RW, Gorman C, Michalon M, Steiner M, Levitt AJ, Corral M, and others. Multicenter, placebo-controlled study of fluoxetine in seasonal affective disorder. Am J Psychiatry 1995;152:1765–70. Crossref, Google Scholar
34 Bech P, Cialdella P, Haugh M, Birkett M, Hours A, Boissel J, and others. Meta-analysis of randomised controlled trials of fluoxetine vs placebo and tricyclic antidepressants in the short-term treatment of major depression. Br J Psychiatry 2000;176:421–8. Crossref, Google Scholar
35 Westen D, Morrison K. A multidimensional meta-analysis of treatments for depression, panic, and generalized anxiety disorder: an empirical examination of the status of empirically supported therapies. J Consult Clin Psychol 2001;69:875–99. Crossref, Google Scholar
36 Weisler R, Johnston J, Lineberry C, Samara B, Branconnier R, Billow A. Comparison of bupropion and trazodone for the treatment of major depression. J Clin Psychopharmacol 1994;14:170–9. Crossref, Google Scholar
37 Smith D, Dempster C, Glanville J, Freemantle N, Anderson I. Efficacy and tolerability of venlafaxine compared with selective serotonin reuptake inhibitors and other antidepressants: a meta-analysis. Br J Psychiatry 2002;180:396–404. Crossref, Google Scholar
38 Burt T, Lisanby S, Sackeim H. Neuropsychiatric applications of transcranial magnetic stimulation: a metaanalysis. Int J Neuropsychopharmacol 2002;5:73–103. Crossref, Google Scholar
39 Holtzheimer P, Russo J, Avery D. A meta-analysis of repetitive transcranial magnetic stimulation in the treatment of depression. Psychopharmacol Bull 2001;35:149–69. Google Scholar
40 Martin J, Barbanoj M, Schlaepfer T, Thompson E, Perez V, Kulisevsky J. Repetitive transcranial magnetic stimulation for the treatment of depression. Systematic review and meta-analysis. Br J Psychiatry 2003;182:480–91. Crossref, Google Scholar
41 Lau J, Ioannidis J, Schmid C. Summing up evidence: one answer is not always enough. Lancet 1998;351:123–7. Crossref, Google Scholar
42 Presby S. Overly broad categories obscure important differences between therapies. Am Psychol 1978;33:514–5. Crossref, Google Scholar
43 Light R. Accumulating evidences from independent studies: what we can win and what we can lose. Stat Med 1987;6:221–8. Crossref, Google Scholar
44 Glass G. Primary, secondary and meta-analysis research. Educ Res 1976;5:3–8. Crossref, Google Scholar
45 Smith M, Glass G. Meta-analysis of psychotherapy outcome studies. Am J Psychol 1977;32:752–60. Crossref, Google Scholar
46 Guyatt G, Pugsley S, Sullivan M, Thompson P, Berman L, Jones N, and others. Effect of encouragement on walking test performance. Thorax 1994:818–22. Google Scholar
47 Peretti S, Judge R, Hindmarch I. Safety and tolerability considerations: tricyclic antidepressants vs. selective serotonin reuptake inhibitors. Acta Psychiatr Scand Suppl 2000;403:17–25. Crossref, Google Scholar
48 Oxman T. Antidepressants and cognitive impairment in the elderly. J Clin Psychiatry 1996;57(Suppl 5):38–44. Google Scholar
49 Lam RW, Kennedy SH. Evidence based strategies for achieving and sustaining full remission in depression: focus on metaanalyses. Can J Psychiatry 2004;49(Suppl 1):17S–26S. Google Scholar
50 Laupacis A, Sackett D, Roberts R. An assessment of clinically useful measures of the consequences of treatment. N Engl J Med 1988;318:1728–33. Crossref, Google Scholar
51 Wahlbeck K, Cheine M, Essali M. Clozapine versus typical neuroleptic medication for schizophrenia. Cochrane Database Syst Rev 2000:CD000059. Google Scholar
52 Moore A, Collins S, Carroll D, McQuay H, Edwards J. Single dose paracetamol (acetaminophen), with and without codeine, for postoperative pain. Cochrane Database Syst Rev 2000:CD001547. Google Scholar
53 O'Connor P, Spann S, Woolf S. Care of adults with type 2 diabetes mellitus. A review of the evidence. J Fam Pract 1998;47:S13–S22. Google Scholar
54 Deeks J, Smith L, Bradley M. Efficacy, tolerability, and upper gastrointestinal safety of celecoxib for treatment of osteoarthritis and rheumatoid arthritis: systematic review of randomised controlled trials. BMJ 2002;325:619. Crossref, Google Scholar
55 Green L. Selections from current literature: the fight over fat. Is pharmacological lipid lowering useful for coronary primary prevention? Fam Pract 1997;14:411–5. Crossref, Google Scholar